- **_Homebuyers came out of the woodwork as mortgage rates posted the biggest monthly decline since 2008._**
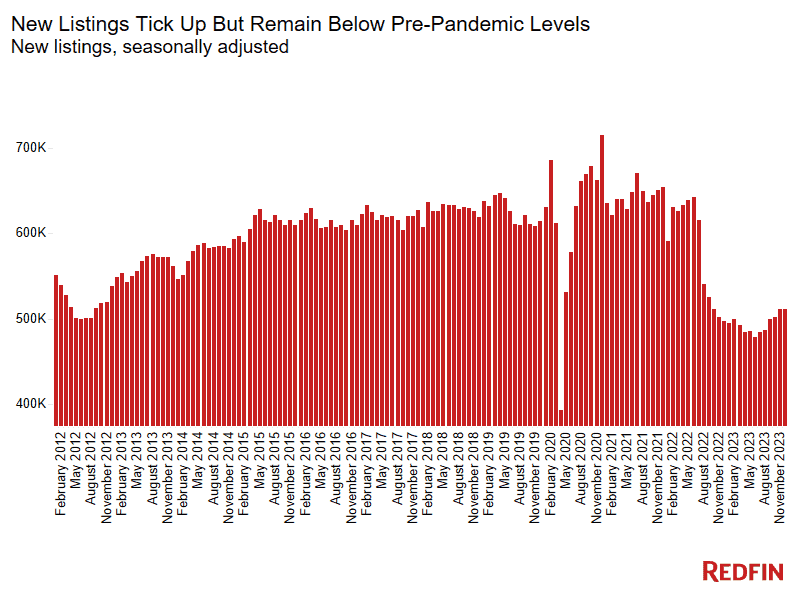
- **_Sellers also came off the sidelines, but not with as much force; new listings_ _rose 0.1% to the highest level since September 2022._**
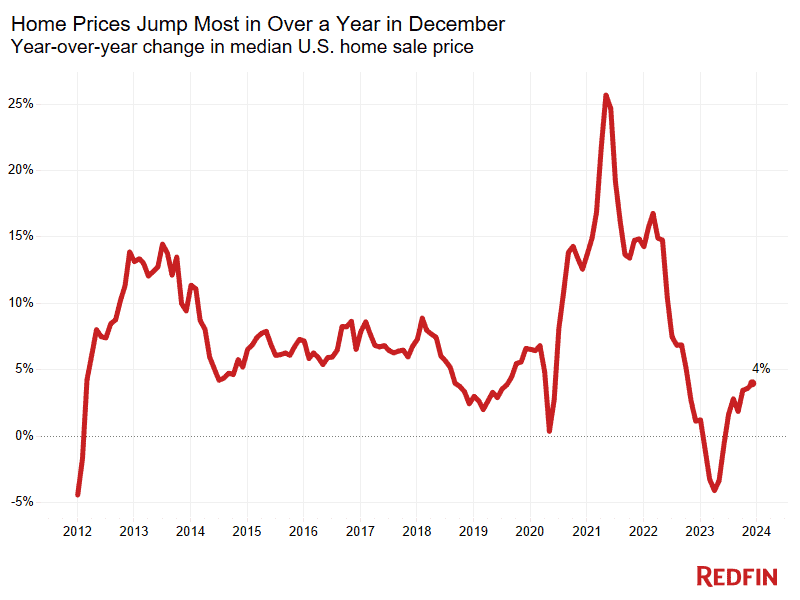
- **_Prices jumped 4%, the most in over a year, as buyers competed for a still-limited pool of homes._**
- **_Redfin agents say bidding wars in some areas are becoming more frequent as people who were browsing when rates were higher get serious about buying. But January is off to a slower-than-expected start amid frigid weather._** Pending home sales rose 4.1% month over month in December on a seasonally adjusted basis—the biggest increase since September 2021—to the highest level in more than a year. They climbed 5.9% from a year earlier, the biggest annual gain since June 2021. 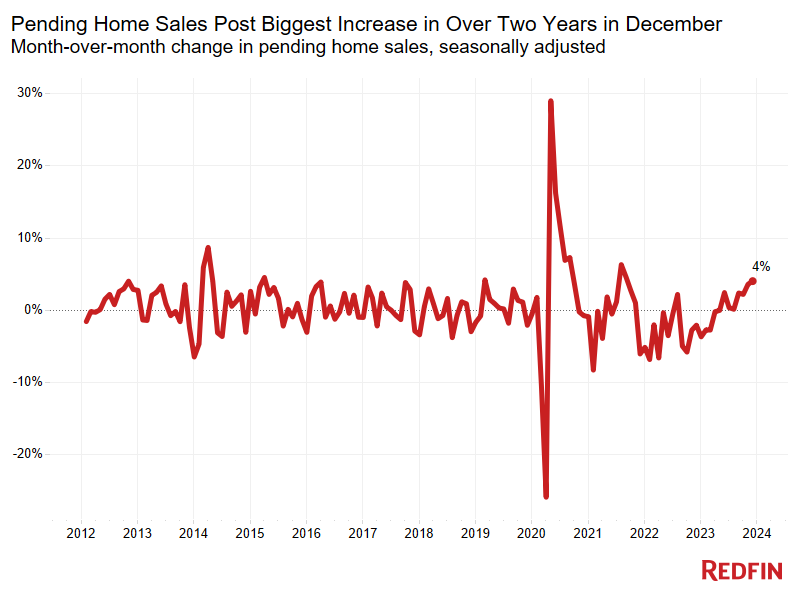 Pending sales jumped because a steep drop in mortgage rates lured buyers to the market. The average 30-year-fixed mortgage rate fell to 6.82% in December from 7.44% in November, the biggest monthly decline since 2008. Buyers who were casually looking when rates were above 7% are now getting serious, Redfin agents say. The dip in mortgage rates has also brought sellers off of the sidelines, though they haven’t returned with as much intensity as buyers, likely because a [majority](https://www.redfin.com/news/mortgage-rate-lock-in-housing-2023/) of them don’t want to give up the ultra low mortgage rate they scored during the pandemic. New listings rose 0.1% month over month to the highest seasonally adjusted level since September 2022, and were up 2.7% year over year—the largest increase since July 2021.  While housing supply has ticked up, it remains below pre-pandemic levels. Active listings, or the total number of homes for sale, rose 3.1% month over month on a seasonally adjusted basis but fell 5.1% from a year earlier. “We’re definitely seeing an uptick in activity from both buyers and sellers,” said [Abby Alwan](https://www.redfin.com/real-estate-agents/abby-alwan), a [Redfin Premier](https://www.redfin.com/premier) real estate agent in [Austin, TX](https://www.redfin.com/city/30818/TX/Austin). “I have two listings in the suburbs that six months ago would’ve sat on the market. But all of a sudden, buyers are coming out of the woodwork thanks to lower rates. More folks are looking to have conversations about what they need to do to enter the market now that they’ve seen improvement in the market.” It’s worth noting that while demand jumped in December, January is off to a slower-than-expected [start](https://www.redfin.com/news/housing-market-update-buyers-sellers-more-active/), likely due to severe winter weather. Redin economists expect the market to pick up as spring approaches, so long as mortgage rates don’t shoot up. ### Home Prices Post Largest Increase in Over a Year The median U.S. home sale price climbed 4% year over year to $403,714 in December, the biggest annual increase since October 2022, and fell 1.1% month over month. Please note that home price data is not seasonally adjusted, and it is not unusual for prices to slow from a month earlier in December. 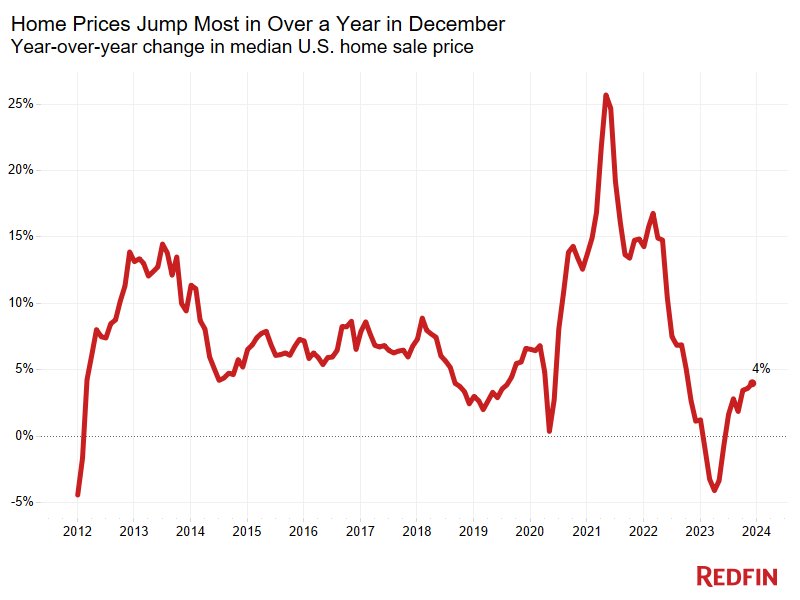 The recent uptick in homebuyer demand is likely contributing to the rise in housing prices, but the primary driver of price increases is America’s persistent shortage of homes for sale, which is fueling competition in some areas. “Bidding wars are happening again, but they’re much more reasonable than they were during the pandemic homebuying frenzy,” Alwan said. “Houses are getting between one and five competing bids, and instead of offering one or two hundred thousand dollars over the asking price, competitive buyers are offering 3% to 5% over.” ### December 2023 Highlights: United States **December 2023** **Month-Over-Month Change** **Year-Over-Year Change** **Median sale price** $403,714 \-1.1% 4.0% **Pending sales, seasonally adjusted** 425,466 4.1% 5.9% **Homes sold, seasonally adjusted** 407,255 \-0.5% \-4.0% **New listings, seasonally adjusted** 511,136 0.1% 2.7% **All homes for sale, seasonally adjusted (active listings)** 1,569,438 3.1% \-5.1% **Months of supply** 2.6 \-0.3 0 **Median days on market** 43 6 \-2 **Share of for-sale homes with a price drop** 14.2% \-5 ppts 0.5 ppts **Share of homes sold above final list price** 25.5% \-3.3 ppts 2.5 ppts **Average sale-to-final-list-price ratio** 98.6% \-0.4 ppts 0.5 ppts **Pending sales that fell out of contract, as % of overall pending sales** 16.2% \-0.1 ppts 0.7 ppts [**Average 30-year fixed mortgage rate**](https://fred.stlouisfed.org/graph/?g=1bnGA) 6.82% \-0.63 ppts 0.45 ppts _Note: Data is subject to revision_ ### Metro-Level Highlights: December 2023 _Data in the bullets below came from a list of the 91 U.S. metro areas with populations of at least 750,000. Select metros may be excluded from time to time to ensure data accuracy. A full metro-level data table can be found in the “download” tab of the dashboard in_ _the monthly section of the Redfin_ [_Data Center_](https://www.redfin.com/news/data-center/)_._ _Refer to our_ [_metrics definition page_](https://www.redfin.com/news/data-center-metrics-definitions/) _for explanations of metrics used in this report. Metro-level data is not seasonally adjusted._ - **Pending sales:** In New Orleans, pending sales rose 40.3% year over year, more than any other metro Redfin analyzed. Next came McAllen, TX (31.8%) and Dallas (25.7%). Pending sales fell most in Honolulu (-27.3%), Knoxville, TN (-24.2%) and Greensboro, NC (-22.8%).
- **Closed sales:** Closed sales rose in just six metros, with the biggest increases in North Port, FL (7.1% YoY), Las Vegas (4.6%) and Salt Lake City (4.4%). Closed sales fell fastest in Tacoma, WA (-23%), Boston (-19.4%) and Frederick, MD (-18.6%).
- **Prices:** Median sale prices rose most from a year earlier in Anaheim, CA (17.6%), Camden, NJ (16.1%) and Rochester, NY (16%). They fell in 10 metros, with the biggest declines in New Orleans (-5.4%), Charlotte, NC (-2.6%) and Austin (-2.4%).
- **New listings:** New listings rose most from a year earlier in Salt Lake City (22.3%), Memphis, TN (18.4%) and McAllen (16.6%). They fell most in San Francisco (-30.8%), Atlanta (-17.6%) and Indianapolis (-15.4%).
- **Overall supply:** Active listings increased fastest in Cape Coral, FL (53.7% YoY), North Port (40.7%) and New Orleans (26%). They decreased fastest in Las Vegas (-31%), New Brunswick, NJ (-25.4%) and Anaheim (-24.6%).
- **Competition:** In Rochester, 65.3% of homes sold above their final list price, the highest share among the metros Redfin analyzed. Next came Newark, NJ (61.3%) and Buffalo, NY (61.2%). The shares were lowest in West Palm Beach, FL (8.6%), Cape Coral (9.4%) and Austin (9.4%).
- **Speed:** In Rochester, 61% of homes that went under contract did so within two weeks—the highest share among the metros Redfin analyzed. Next came Grand Rapids, MI (48.5%) and Cincinnati (46.6%). The lowest shares were in Honolulu (2.4%), Knoxville (6%) and Lake County, IL (8.8%). ### Home-Purchase Cancellations _Data below came from a list of the 50 most populous metro areas._ **Metro Area** **December 2023: Pending Sales That Fell Out of Contract, as % of Overall Pending Sales** **November 2023: Pending Sales That Fell Out of Contract, as % of Overall Pending Sales** **December 2022: Pending Sales That Fell Out of Contract, as % of Overall Pending Sales** Anaheim, CA 12.7% 15.5% 15.9% Atlanta, GA 23.6% 24.6% 25.5% Austin, TX 13.3% 14.8% 16.5% Baltimore, MD 14.1% 14.0% 14.5% Boston, MA 10.2% 11.1% 11.5% Charlotte, NC 12.7% 13.5% 13.6% Chicago, IL 18.3% 17.5% 17.2% Cincinnati, OH 14.1% 14.6% 14.2% Cleveland, OH 19.2% 22.6% 20.5% Columbus, OH 16.4% 16.6% 16.9% Dallas, TX 16.5% 18.9% 20.3% Denver, CO 16.7% 18.4% 19.3% Detroit, MI 18.7% 16.9% 17.2% Fort Lauderdale, FL 22.2% 21.7% 20.1% Fort Worth, TX 17.8% 18.7% 20.4% Houston, TX 18.7% 18.7% 19.4% Indianapolis, IN 18.3% 17.7% 17.3% Jacksonville, FL 21.6% 23.7% 25.7% Kansas City, MO 15.9% 16.0% 14.4% Las Vegas, NV 19.8% 21.3% 17.7% Los Angeles, CA 15.5% 16.6% 14.3% Miami, FL 19.8% 20.1% 17.4% Milwaukee, WI 10.5% 11.2% 11.9% Minneapolis, MN 11.5% 11.1% 9.6% Montgomery County, PA 9.9% 8.7% 10.9% Nashville, TN 14.9% 16.6% 14.5% Nassau County, NY 5.5% 5.6% 5.2% New Brunswick, NJ 10.8% 12.0% 13.0% New York, NY 8.9% 9.0% 8.2% Newark, NJ 10.7% 10.4% 10.3% Oakland, CA 10.7% 10.1% 11.5% Orlando, FL 22.4% 21.3% 20.4% Philadelphia, PA 11.7% 11.8% 12.9% Phoenix, AZ 17.8% 19.0% 18.8% Pittsburgh, PA 17.1% 16.8% 16.2% Portland, OR 13.8% 15.2% 14.7% Providence, RI 12.5% 13.0% 12.7% Riverside, CA 17.4% 17.8% 18.6% Sacramento, CA 14.9% 16.0% 16.7% San Antonio, TX 20.4% 19.4% 12.1% San Diego, CA 12.6% 15.9% 13.1% San Francisco, CA 6.5% 5.6% 4.1% San Jose, CA 6.9% 6.4% 7.8% Seattle, WA 10.1% 11.0% 11.9% St. Louis, MO 17.2% 15.5% 16.7% Tampa, FL 20.6% 21.0% 21.6% Virginia Beach, VA 15.6% 16.1% 14.3% Warren, MI 11.9% 12.6% 12.7% Washington, DC 14.3% 12.6% 14.9% West Palm Beach, FL 17.0% 17.3% 17.6% **National—U.S.A.** **16.2%** **16.3%** **15.5%** Lily Katz, Redfin January 19, 2024 facebook-letter-logo x-logo linkedin-logo pinterest-logo [Facebook](https://www.facebook.com/sharer.php?u=https%3A%2F%2Fapfreg.com%2Fpending-home-sales-rose-4-in-december-biggest-jump-in-over-two-years%2F) [X](https://x.com/intent/post?url=https%3A%2F%2Fapfreg.com%2Fpending-home-sales-rose-4-in-december-biggest-jump-in-over-two-years%2F&text=Pending+Home+Sales+Rose+4%25+in+December%E2%80%94Biggest+Jump+in+Over+Two+Years) [Pinterest](https://pinterest.com/pin/create/link/?url=https%3A%2F%2Fapfreg.com%2Fpending-home-sales-rose-4-in-december-biggest-jump-in-over-two-years%2F) [LinkedIn](https://www.linkedin.com/shareArticle?mini=true&url=https%3A%2F%2Fapfreg.com%2Fpending-home-sales-rose-4-in-december-biggest-jump-in-over-two-years%2F&title=Pending+Home+Sales+Rose+4%25+in+December%E2%80%94Biggest+Jump+in+Over+Two+Years&summary=Homebuyers+came+out+of+the+woodwork+as+mortgage+rates+posted+the+biggest+monthly+decline+since+2008.+Sellers+also+came+off+the+sidelines%2C+but+not+with+as+much+force%3B+new+listings%C2%A0rose+0.1%25+to+the+highest+level+since+September+2022.+Prices+jumped+4%25%2C+the+most+in+over+a+year%2C+as+buyers+competed+for+a+still-limited+pool+of+%5B%E2%80%A6%5D)